How to Build a Simple Monthly Social Media Report
Build a monthly social media report in under an hour: pick five numbers, add honest context, log your experiments, and choose next month's bets.

Monthly reports have a bad reputation. They take hours, nobody reads them, and by the time you finish one, the next month has already started. So most creators and small teams skip them entirely.
Here is the thing: a good monthly report does not need to be long. It needs to be honest. Five numbers, a few sentences of context, a note about what you tried, and a decision about what to do next. That is the whole job.
This guide walks you through a report you can build in under an hour, once a month. It works whether you are a solo creator, a small brand, or an agency reporting to clients.
Why bother with a monthly report
Weekly numbers are noisy. Daily numbers are chaos. One viral post or one quiet weekend can swing them wildly. A month is long enough for real patterns to show up, and short enough that you can still act on what you find.
A monthly report also builds a paper trail. Six months from now, you will not remember why March felt slow. Your report will. That memory is worth more than any dashboard.
- It forces a decision. A report that ends without a "so what" is just a screenshot.
- It catches slow drifts. A small dip in one week means nothing. The same small dip four months in a row is a trend, and you will only see it if you write things down.
- It makes hard conversations easier. With a client or a boss, "here is what we tried and what we learned" beats "trust me, it's working."
Step 1: Pick your five numbers
Do not report everything. Pick five numbers that map to what you actually care about, and keep the same five every month so you can compare. A solid default set:
- Reach — how many people saw your content this month
- Engagement — likes, comments, saves, and shares, combined
- Net follower change — gains minus losses, per account
- Link clicks or profile visits — a rough proxy for intent
- One business number — email signups, sales, bookings, inquiries
If you are not sure which metrics deserve a spot, read our guide to social media metrics that matter. It walks through which numbers connect to real goals and which are just decoration.
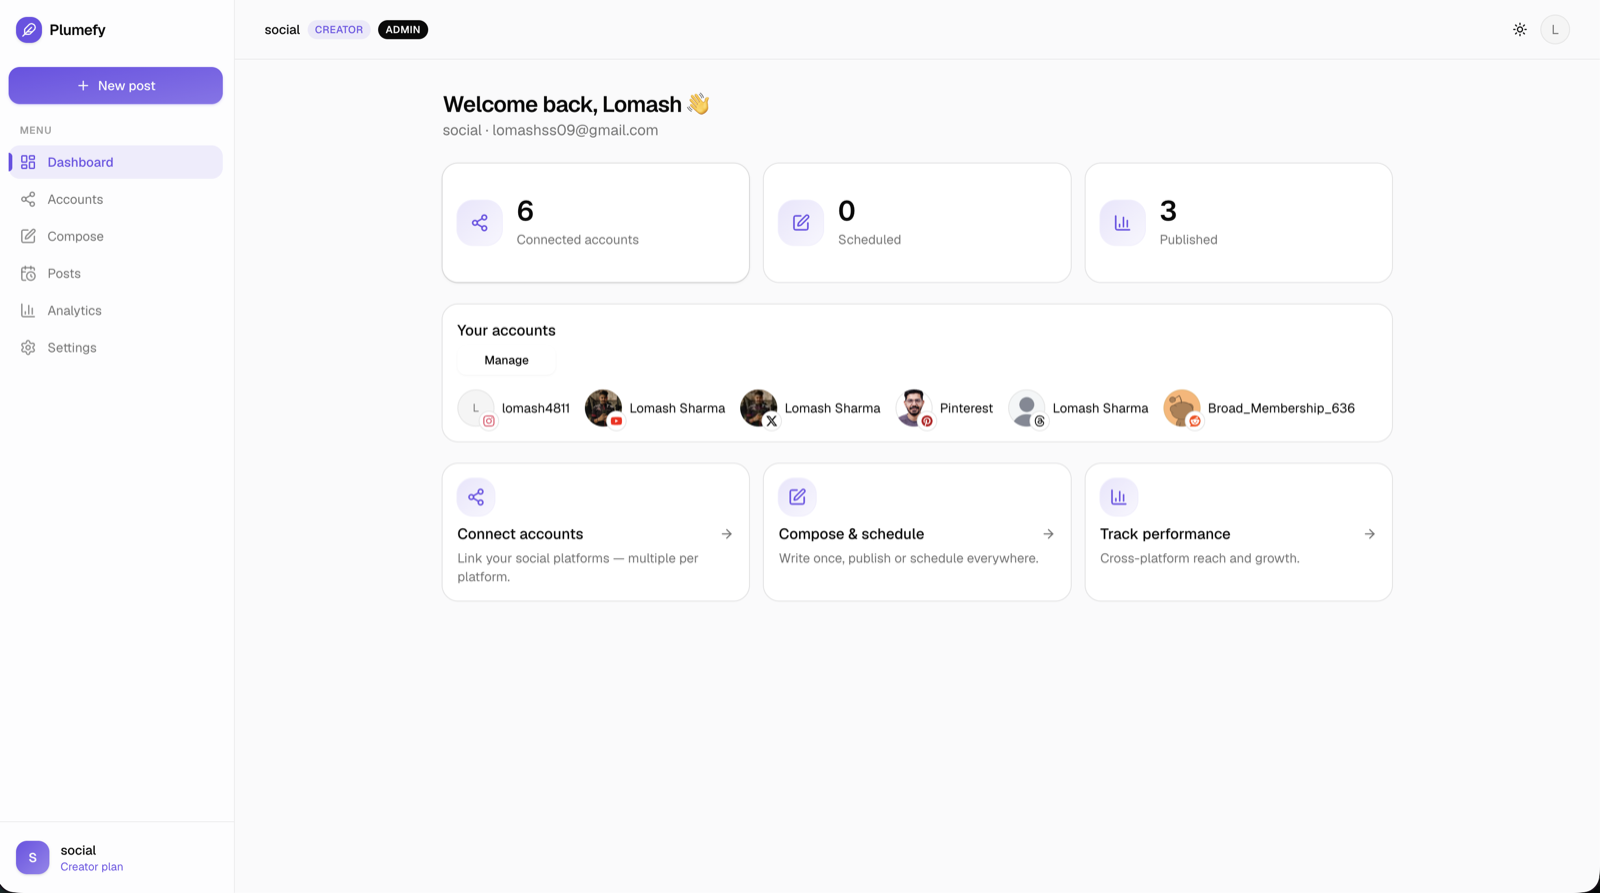
Pull each number per platform, plus a rough total. If clicking through four different native analytics tabs makes you want to quit, this is exactly what Plumefy's combined dashboard is for: reach, engagement, and follower growth for every account, across platforms, in one view.
Step 2: Add context
A number without context is a trivia fact. For each of your five numbers, write one sentence that answers two questions: is this up or down from last month, and do I know why?
| Number | This month | Last month | One-line context |
|---|---|---|---|
| Reach | your figure | your figure | "One Reel carried the month" |
| Engagement | your figure | your figure | "Saves up since we added checklists" |
| Follower change | your figure | your figure | "Slowed after we skipped a week" |
The context column is the actual report. It is where "reach was down" becomes "reach was down because we posted half as often." The first is a worry. The second is a plan.
Be honest in this column. "I don't know why" is a perfectly good entry. It tells future-you where to dig.
Step 3: Note your experiments
Every month you tried something, even if you did not call it an experiment. A new hook style. A different posting time. A format you had never touched. For each one, write down three things:
- What you tried. "Posted carousels instead of single images for two weeks."
- What you expected. "More saves."
- What actually happened. "Saves roughly doubled, comments dipped."
Three bullets per experiment is plenty. This section keeps you honest. Without it, you will re-run the same failed test six months from now and feel clever doing it.
Step 4: Decide next month's bets
End the report with exactly three decisions:
- One thing to double down on. Whatever clearly worked, do more of it, on purpose.
- One thing to stop. Something that costs time and returns little. Cutting it is a win, not a failure.
- One thing to test. A single new experiment with a written prediction.
Three is a feature, not a limit. Ten decisions means zero decisions. If your posting rhythm is one of the things under review, our guide to building a social media posting schedule will help you turn next month's plan into an actual calendar.
A template you can steal
Here is the whole report, in order. Copy it into a doc and fill it in monthly:
- Header: month, accounts covered, one-sentence summary
- The five numbers: the table from Step 2, with context lines
- Experiments: what you tried, expected, and got
- Next month's bets: double down, stop, test
- One open question: the thing you could not explain this month
That last item matters more than it looks. Open questions from this month become experiments next month. That loop is the entire engine of improvement.
Keep the data pull under 15 minutes
The report dies the moment collecting numbers takes longer than thinking about them. Two ways to protect yourself: pull data on the same day each month so it becomes a habit, and keep every account in one place. Plumefy shows reach, engagement, and follower growth per account across all your connected platforms in a single dashboard, and the free plan covers two accounts if you want to see how that feels — try Plumefy free.
FAQ
How long should a monthly report be?
One page. If it does not fit on one page, you are reporting data instead of making decisions. Move extra charts to an appendix nobody has to read.
What if a client wants more detail?
Keep the one-page summary on top and attach the raw numbers behind it. Most clients read the summary and the three bets, then skim the rest. The summary is what they will remember.
Should I include follower count if it is a vanity metric?
Yes, but as context, not as the headline. Net follower change tells you whether your audience is growing, and clients expect to see it. Just never let it be the only number in the room.
What if a month was just bad?
Say so, plainly, and write down your best guess why. A report that only ever says good things stops being read. The bad months are where the useful lessons live.
Post everywhere, once.
Start on the free plan — no card needed, upgrade when you need scheduling.
Start free