Why Engagement Rates Differ Across Platforms
Engagement rates differ across platforms by design. Learn why the numbers aren't comparable, how to judge each account fairly, and how to set your own baseline.
Your Instagram engagement rate is triple your LinkedIn rate, and TikTok looks different from both. So which account is "doing well"? If you are comparing the raw percentages, the honest answer is: you cannot tell. Not because the math is hard, but because the platforms are playing different games.
Comparing engagement rates across networks is like comparing free-throw percentage to batting average. Both are percentages. Both measure skill. And putting them in the same column tells you nothing.
Here is why the numbers differ by design, how to judge each of your accounts fairly, and how to build the only benchmark that means anything: your own.
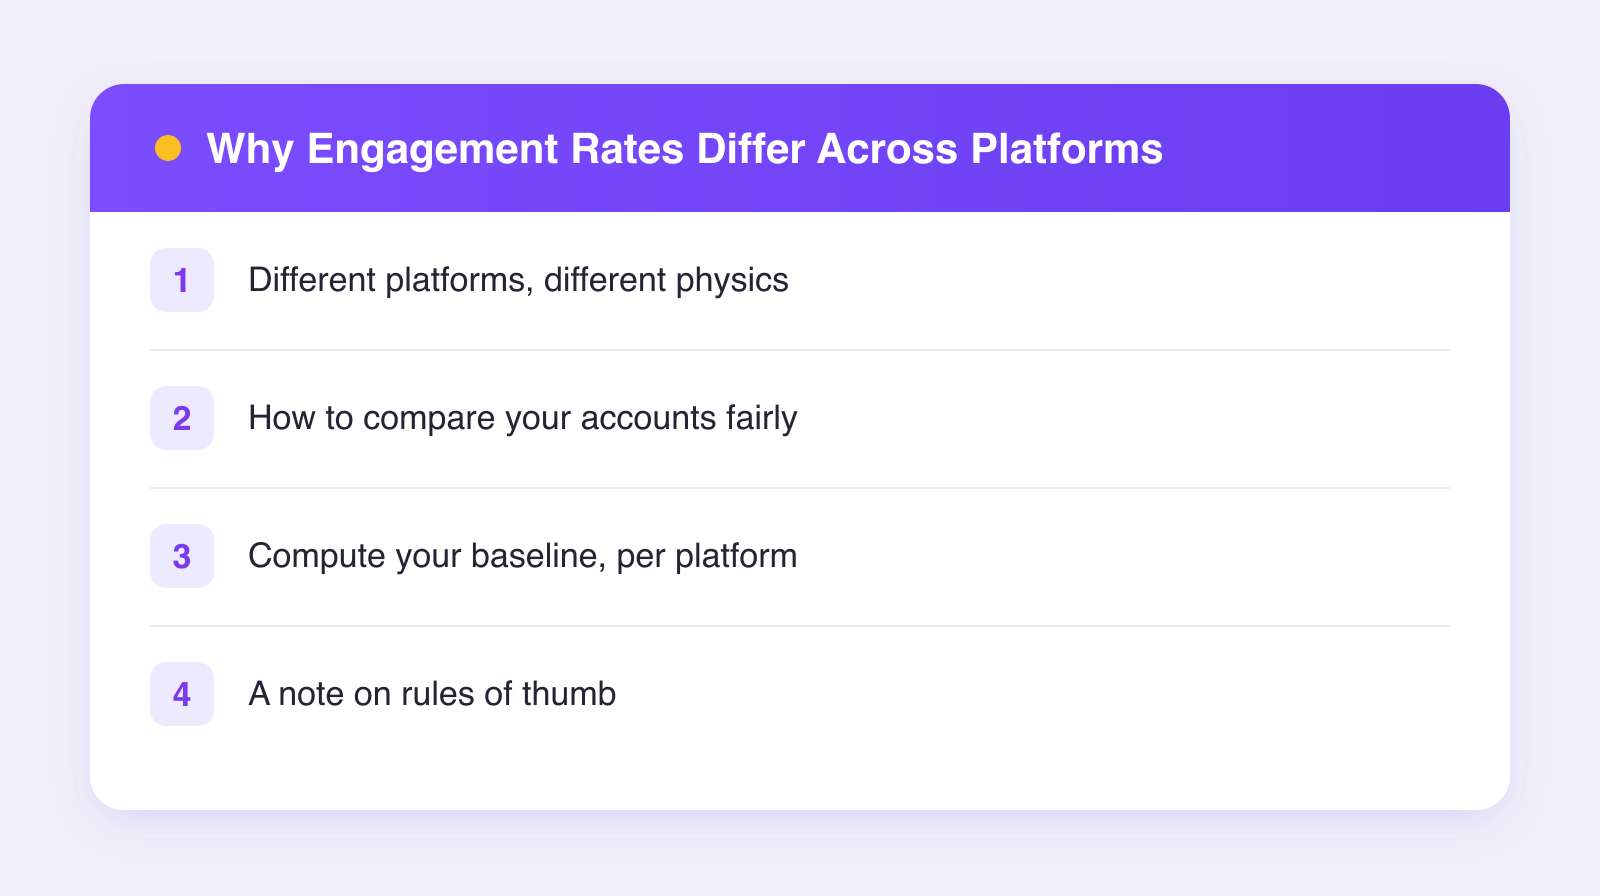
Different platforms, different physics
As of 2026, the major networks differ in at least four structural ways that move engagement math around:
Who sees your posts
On discovery-driven feeds like TikTok and Reels, most viewers may have never seen your account before. Strangers engage less per view than fans do, so heavy discovery tends to mean big reach and a lower engagement percentage — which is a success, not a failure. On follower-centric feeds, a larger share of viewers already like you, which flatters the rate while capping the reach.
What counts as engaging
Each network offers different actions with different friction. A double-tap like is nearly free. A comment costs effort. Some platforms emphasize saves and shares, others reactions and reposts, others watch time — which often is not counted in "engagement" at all, even though it is the strongest signal on video-first platforms.
How the denominator is defined
Engagement rate is engagement divided by... what? Followers? Reach? Impressions? Different tools and different native dashboards choose differently, and each choice changes the number substantially. A "rate by followers" punishes accounts with high non-follower reach; a "rate by reach" flatters them.
What the culture rewards
Commenting is a habit on LinkedIn, rarer on X for many niches. Saves are a currency on Instagram. None of this reflects your content quality — it reflects how people behave on each app.
Stack those four differences and cross-platform comparison of raw rates is meaningless by construction.
How to compare your accounts fairly
You can still compare — you just have to compare the right things:
- Compare each account to its own history, not to the other accounts. Instagram-this-month versus Instagram-last-quarter is a real comparison. Instagram versus LinkedIn is not.
- Compare trends, not levels. If TikTok's rate is climbing and Instagram's is flat, that is decision-grade information, even though the two levels themselves are incomparable.
- Compare each platform's own strongest signal. Watch-through on video platforms, saves and shares on Instagram, comments and reposts where conversation dominates. Judge each account at the game it is actually playing — one more reason to tailor posts per platform rather than grading everything on one rubric.
- Normalize the denominator. Whatever formula you choose, use the same one for a given account every time. Consistency beats correctness here; a slightly imperfect formula applied identically is far more useful than a perfect one applied inconsistently.
Compute your baseline, per platform
Here is the whole procedure. Do it once per account, refresh quarterly:
- Pick a formula and freeze it. A reasonable default: (likes + comments + saves + shares) ÷ reach × 100, per post. Use followers as the denominator only if reach data is unavailable.
- Pull your last 20 to 30 posts on that platform and compute the rate for each.
- Take the median, not the mean — one outlier post will drag an average around.
- Write it down with the date and formula. That median is your baseline for that account.
- Judge new posts against it. Above baseline: something worked, figure out what. Below for weeks: something changed, diagnose it.
If you want help deciding what counts as "good" on Instagram specifically, we wrote a whole piece on what a good engagement rate on Instagram really means — spoiler: the answer is also "relative to your own numbers."
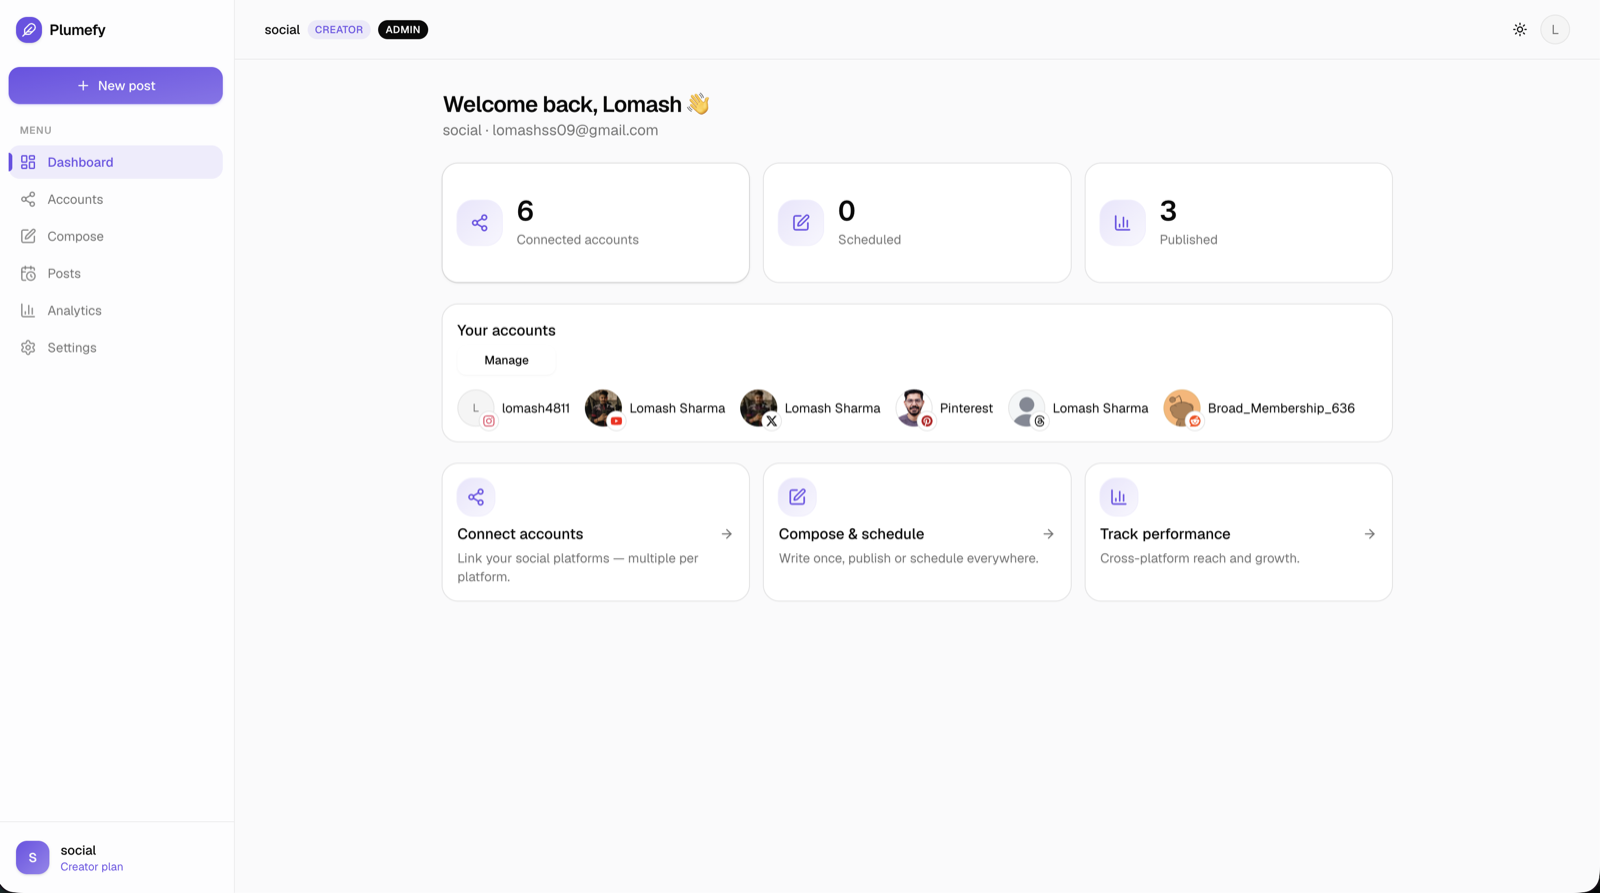
Doing this across four or five networks with native analytics tabs is genuinely tedious, which is why most people never build baselines at all. Plumefy's combined analytics puts reach and engagement for every account — across all your platforms — in one dashboard, so a quarterly baseline refresh takes minutes instead of an afternoon.
A note on rules of thumb
You will find plenty of articles quoting "average engagement rates" per platform to one decimal place. Treat them as folklore. They vary by how the study defined the metric, which accounts it sampled, and when. The only rough rule of thumb we will stand behind: smaller audiences almost always show higher engagement percentages than huge ones, on every platform, because early followers are your warmest. If your rate falls as you grow, that alone is not decline — check whether absolute engagement is still rising.
That is also why multi-platform creators should expect a spread of numbers across their accounts and feel fine about it. Plumefy lets you cross-post to up to 11 networks and read each account against its own history, which is the fair fight — try Plumefy free.
FAQ
Which platform has the highest engagement rate?
The question has no stable answer, because the metric is defined differently on each. Any ranking you read reflects methodology as much as reality. Rank your own accounts by trend against their own baselines instead.
Should I use followers or reach as the denominator?
Reach, when you can get it — it measures engagement among people who actually saw the post. Followers is acceptable as a fallback. Whichever you pick, never switch silently, or your trend line becomes fiction.
My engagement rate dropped as my account grew. Did I get worse?
Probably not. Growing reach pulls in colder audiences who engage less per view. Look at absolute engagement and follower quality alongside the percentage before drawing conclusions.
Is a high engagement rate always good?
Mostly, but check the composition. A rate propped up by one controversy's angry comments is not the same as one built on saves and shares. Read the mix, not just the total.
Post everywhere, once.
Start on the free plan — no card needed, upgrade when you need scheduling.
Start free